Search Results
The Search Results screen displays the output of Advanced and Saved Searches in various display modes.
- Open Video Search on the top bar open Saved Searches.
- Click the Search you want to view the results of.
Results can displayed in multiple view modes:
The full frame view displays the video snapshots with the detected objects highlighted. The object type is displayed in the top left corner of the bounding box.
Hover over a thumbnail to play a video segment from that timestamp. Click on a thumbnail to display a popup containing the snapshot image as well as a video segment of the event.
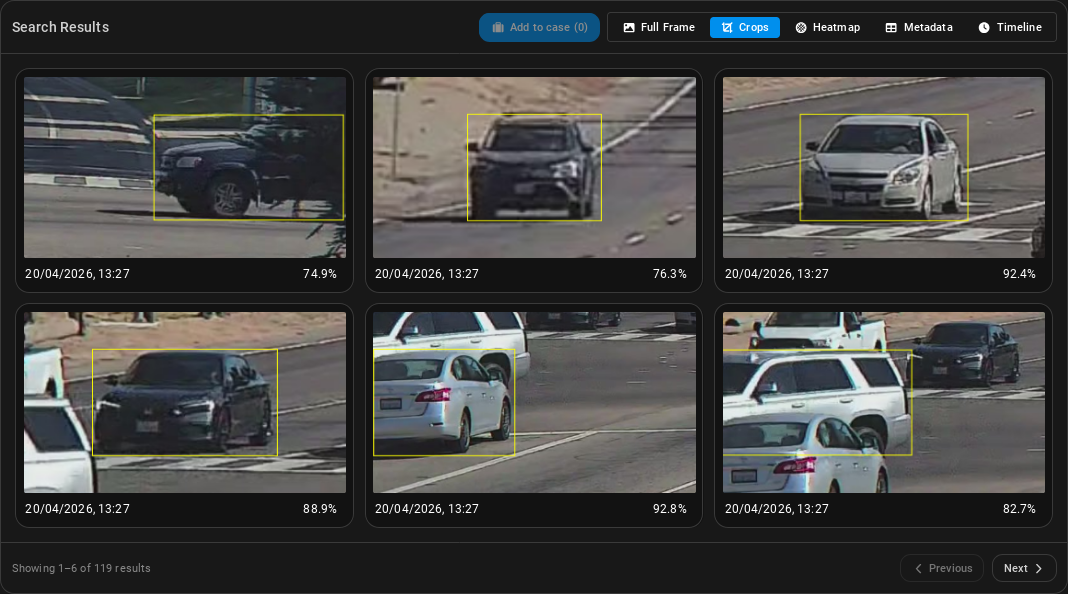
The crops view displays an image crop of the detected objects.
Click on an image to display a popup containing a snapshot image as well as a video segment of the event.
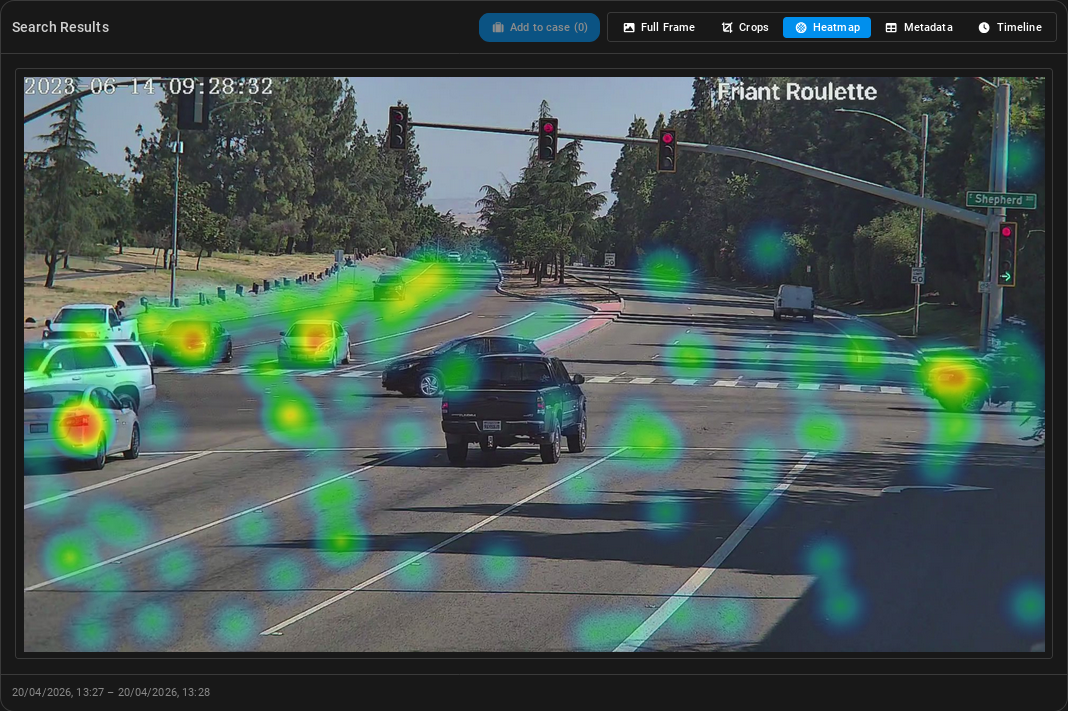
The heatmap displays the detected objects over time in a heatmap format. It can be used to visualize the density of detections over time. The colouring indicates the density of detections in that area, with warmer colors indicating higher density.
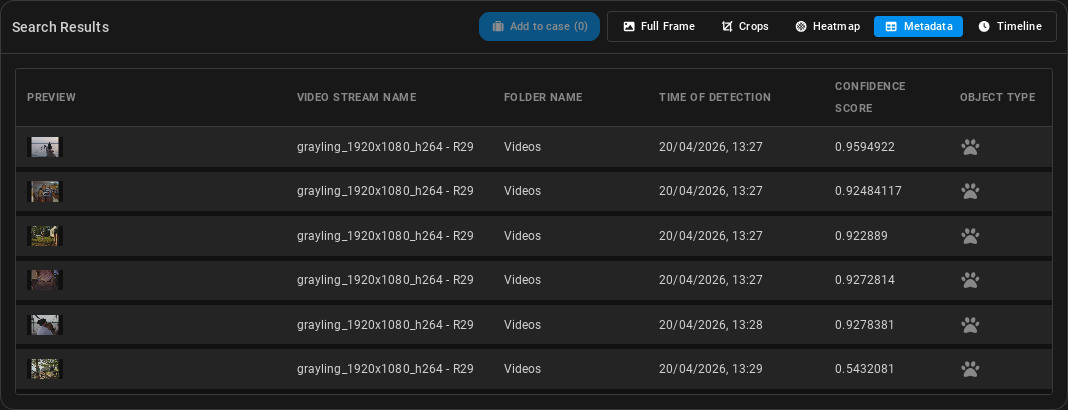
The table contains the metadata of the detected objects; This includes the object type, confidence score, and timestamp of the detections.
Click on a row to display a popup containg a snapshot image as well as a video segment of the event.
Click on the menu on the right side of a row to view additional metadata of the event, such as the X,Y coordinates and the width and height of the bounding box.
The metadata is available in CSV format for download. Click on the Download all button at the bottom of the page to download the metadata as a CSV file.
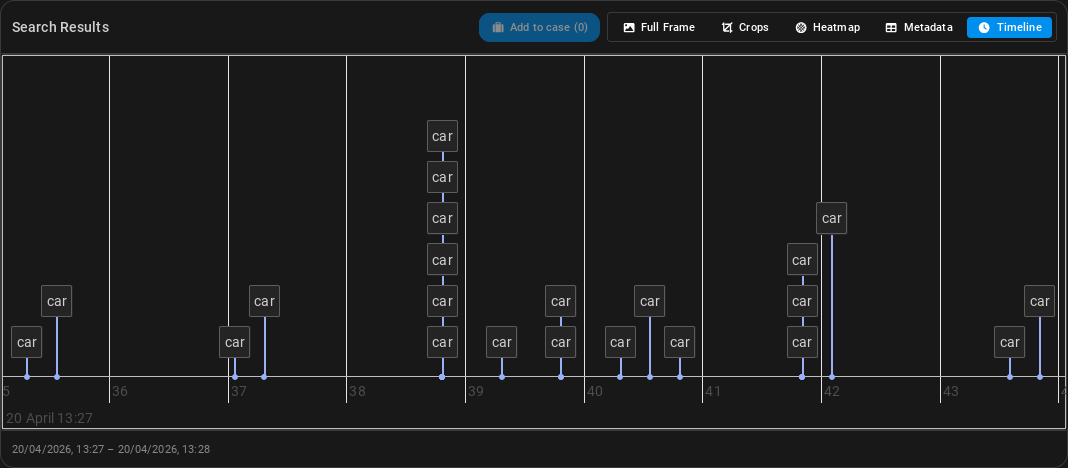
The timeline displays the detected objects over time. The timeline can be used to navigate through the video and view the detections at specific timestamps.
Click on a detection in the timeline to display its thumbnail on the right. Click on the thumbnail to display a snapshot image as well as a video segment of the event.
Scroll through the timeline by dragging it with a left-click. Zoom in and out by scrolling up and down with the mouse wheel.
If the Rule is run on a live RTSP stream, the timeline will display the detections in real-time, with the current time marked by an orange vertical line. The timeline will automatically scroll to the right as new detections are made.